

TL;DR
Short answer: No. In our Q4 2025 test, a 28-follower account received more views than a 20,000-follower verified account. Follower count, account age and verification did not predict distribution in this sample. Buffer’s larger dataset shows Premium accounts do get more reach on average, so we treat our verified account as an exception to explain, not a rule to generalize.
One of the most controversial changes Elon Musk made after his acquisition of Twitter was the monetization of its verification program. Back in the day, Twitter provided a blue check to celebrities, journalists, and those whothat it deemed at risk of impersonation. Musk argued that the blue check program produced a “privileged class” of users, and decided to open up verification to anyone willing to pay for it. This also would help the company develop revenue streams beyond advertising.
The initial pricing for verified plans was $8/month. Eventually, X developed a three-tier pricing structure, plus special pricing plans for business profiles. Additionally, verified users in the highest pricing tiers are able to monetize their tweets’ engagement, with payouts spanning from a few dollars to thousands.
Although originally Musk and the new Twitter leadership hoped that the new verified users would be less likely to incur in harmful behavior, since the program launched:
- Verified users have been involved in memecoin scams, impersonation and other harmful behavior.
- Thousands of engagement-baiting and automated profiles have bloomed, decreasing X’s average content quality.
However, some interesting content still lives on Twitter – you just have to find it. But as a brand – how can you make it easier for users to find you? Especially at this point in internet history, optimizing your content for discoverability is a favor you do to your audience, helping them find entertaining/informative/original content in a sea of AI-generated sameness.
Three X profiles, three different stories and three different niches
In Q4 2025, we monitored and experimented with three X accounts we managed:
- Account A: A verified account started in 2013, with the highest-tier X plan, c.20k followers (including many renowned accounts that were verified before paid verification was rolled out).
- Account B: A new, public account with no blue checkmark and 28 followers.
- Account C: A private account with no blue checkmark, started in 2018, with 456 followers.
Followed-follower ratio (the amount of users someone follows per follower they have) has historically been an indicator of content quality, as well as a signal of authenticity. It’s very common for bots to have a very high volume of followed accounts and little to no followers of their own.
When it comes to followed-follower (f-F) ratio:
- Account A has a f-F ratio of 0.04-1
- Account B has a f-F ratio of 1.5-1
- Account C has a f-F ratio of 0.5-1
When it comes to activity levels:
- Account A published an average of 1 tweet every other day.
- Account B published with a frequency of under 1 tweet per week.
- Account C published approximately 10 times a day.
When it comes to topic coverage:
- Account A mostly replies to high-engagement news articles with short insights and memes. Account A focuses on finances, world events and politics – three of X’s most active niches.
- Account B mostly retweets or replies to lighter content, focused on relationships, personal anecdotes and dating. Original content is scarce.
- Account C is a mix between the two.
The three accounts published content in Spanish. None of the accounts feature the user’s legal name or other identifying information.
Our goal was to test three hypotheses:
- Does account age affect visualizations?
- Does paying for the highest premium plan affect visualizations (as promised by X itself)?
- What type of sentiment is currently producing the most engagement?
Our findings
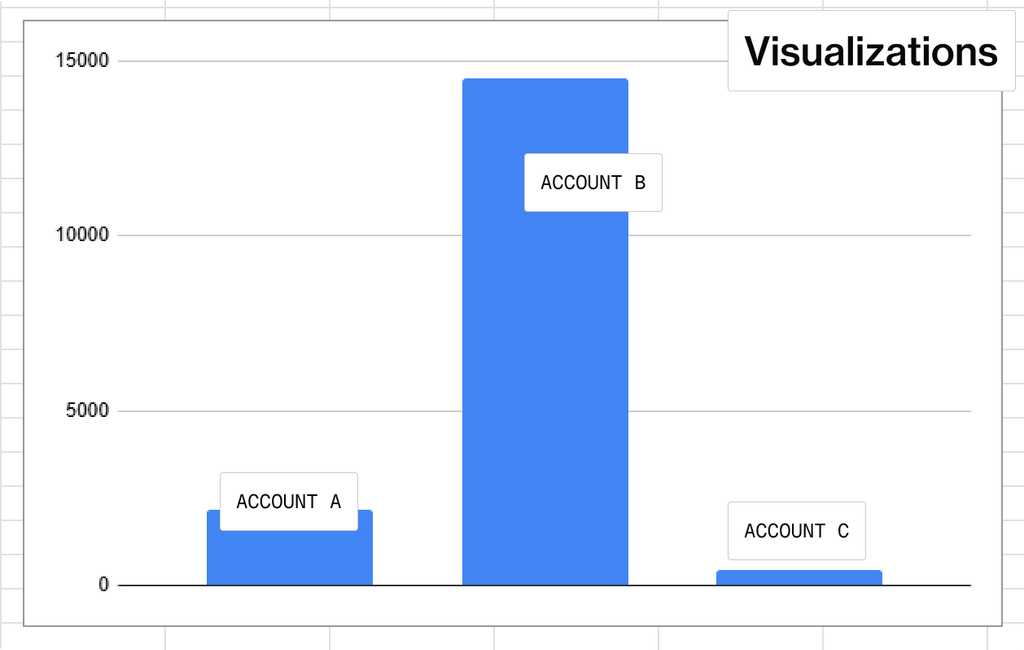
- As expected, Account C’s visualizations have been below its total number of followers. Considering that access to the account’s content is reserved for its followers, this is reasonable. Retweets were 0 across this account’s sample.
- Account B saw the highest volume of visualizations.
- In spite of the promised visibility boost and its medium-size follower base, Account A’s tweets were only shown to a small number of users.
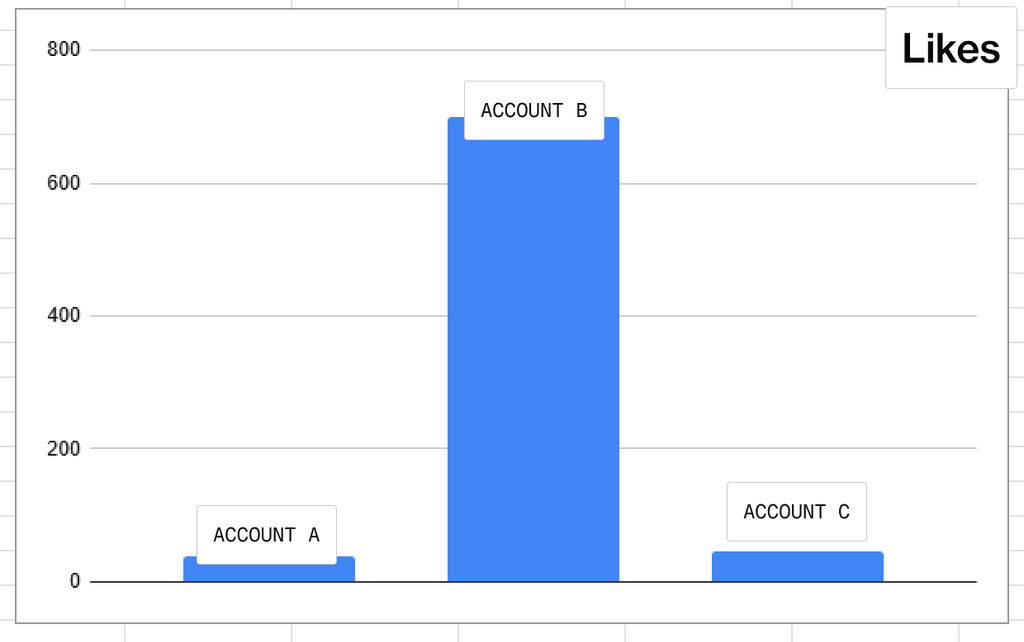
- Account B was a winner, with like counts in the third digits (vs. Account A & Account C).
- General engagement was consistent with the volume of visualizations. More visualizations = more volume.
- If we track engagement-follower ratio, Account C gets the lead, with 10 engagements per 100 followers.
So, what does this mean?
- A historied account with a large follower count, a healthy followed-follower ratio and a moderate publishing volume doesn’t have guaranteed distribution. What worries us isn’t engagement rates but low distribution. Without a high-enough visualization volume, high engagement rates are impossible.
- Publishing frequency doesn’t seem to be a factor.
- Non-specialized, relationships & pop culture-related content has a higher potential for distribution and engagement than political content. This may be an attempt by X to attract new users and distance itself from its reputation as a politically problematic platform.
Why Sports Brands Outperform Everyone on Twitter
Despite overall declining engagement on X, the sports niche remains a notable exception where marketers can still find relatively high user engagement. In the past year, sports teams have kept one of the highest interaction rates in the platform. In 2024 and 2025, sports content achieved an average engagement rate around 0.07%, more than double the platform average of about 0.029%. This contrasts with media brands, which experience much lower engagement rates (near 0.009%). Sports teams also post frequently—around 44 tweets per week—helping maintain strong audience interaction compared to other sectors.
Let’s explore some potential reasons behind this anomaly.
- Frequent, real-time posting: Sports teams post very actively—around 44 tweets per week—keeping fans constantly updated with live scores, highlights, and news, which sustains ongoing conversations and engagement. Twitter was great for tracking real-time events and X still is. However, it’s worth considering that, as our experiment shows, content volume alone doesn’t bring results.
- Dedicated content portals and aggregation: Leagues like the NBA and NFL have launched dedicated portals on X that aggregate content from teams, players, and media, creating a centralized hub for fans to follow and interact with real-time updates and exclusive video highlights.
- Community and emotional investment: Sports fans are highly engaged and emotionally invested in their teams, making them more likely to interact with content through likes, retweets, and replies. The platform’s algorithm favors tweets with high engagement, amplifying visibility for sports-related posts.
- Preference for fresh, time-sensitive information: X users favor informative, relevant, and trending content. Sports content naturally fits this demand by providing timely, newsworthy updates and participation in trending conversations, which drives higher engagement.
- Multimedia content boost: Tweets with videos and images, common in sports posts, attract significantly more engagement. Video views and completion rates help keep fans engaged longer, enhancing interaction metrics.
- Year-round fan engagement strategies: Sports organizations are increasingly offering immersive, interactive experiences beyond game days, such as behind-the-scenes content, live draft coverage, and exclusive athlete streams, keeping fans connected throughout the year.
Does X Premium increase reach?
Across large datasets, it seems to be the case. Buffer analyzed 18.8 million posts from 71,000 accounts between August 2024 and August 2025 and found median Premium reach near 600 impressions per post, Premium+ above 1,550, and regular accounts under 100.
But Buffer’s study is observational – and it’s hard to determine what came first, if it was the chicken or the egg. The study compares groups rather than randomizing them, so people who pay may also post more or better. Are good posters simply more likely to buy a premium X subscription? The Buffer study also measures medians, which hide individual outliers like our Account A. Our result fits that picture only if something other than the subscription dominated Account A’s reach. The next sections cover what could.
A look inside the X algorithm: How does X rank posts in 2026?
X published the code behind its For You feed on January 20, 2026, then added the scoring parameters and visibility-filtering systems on August 13 and 14. The ranking scorer multiplies the model’s predicted probability of each user action by a weight, then sums the results.
According to one reading of the public parameter file, the defaults in param.rs put a like at 0.5, a repost at 1.0, a reply at 5.0, and a share by copied link at 20.0. These weights scale predicted probabilities, not raw engagement counts, and X added comments to its own repository saying so. Read them as “what the model values,” not “how many likes a reply is worth.”
Which mechanisms could explain our results?
These are hypotheses drawn from the repository, not findings. Our test ran in Q4 2025 and the code is from 2026, so the code describes the current system, not necessarily the one we measured.
| Mechanism in X’s code | Account it may explain | How to test it |
|---|---|---|
| Replies and reposts from accounts a viewer doesn’t follow are removed before scoring in For You | A and B (both mostly replies and retweets) | Compare views on replies vs. original posts from the same account |
| A new-author boost lifts posts from authors below an impressions threshold, per the ranking scorer | B | Track B’s views as its impression history grows |
| Visibility filtering takes account of whether an account is protected | C | Not testable without a public twin account |
| Each additional post from the same author is multiplied by a decaying factor, and posts older than 48 hours are dropped | C (about 10 posts a day) | Vary posting cadence, hold topic fixed |
What should operators measure first?
Measure eligible reach first, then response, then business conversion, then what you learned. A post that is never shown cannot generate a meaningful engagement test, and an engagement rate on 40 views proves little about the channel.
| Layer | Question | Metric |
|---|---|---|
| Distribution | Was it shown to enough relevant people? | Views per post, segmented by format and topic |
| Response | Did exposed users react? | Replies, link-copy shares, reposts, profile visits per 1,000 views |
| Conversion | Did attention produce an action? | Tagged signups, demos, subscriptions |
| Learning | What does the next post test? | A written hypothesis |
How should you test X distribution yourself?
Run one public account for four weeks and change one variable at a time.
| Question | Design | Decision rule |
|---|---|---|
| Does topic matter? | Alternate two topics, same format and window | Keep a topic only if it lifts qualified views across several posts |
| Does format matter? | Same idea as short text and as media | Keep the one with more qualified actions per view |
| Does verification matter? | Compare matched posts before and after a plan change | Provisional until it repeats |
| Do replies beat originals? | Same thesis as an original and as a reply | Choose by profile visits or tagged actions |
Pre-register the question, archive the raw export before charting, and publish the dataset.
What would change our conclusion?
If a controlled test shows verified accounts reliably out-reaching matched unverified accounts, we will say Premium buys distribution and report the size of the effect. Until then, treat verification as a credibility and feature choice, and treat reach as something you measure per account.
Is Twitter marketing still worth it in 2026?
We leave that for you to decide! But, in spite of worrying metrics, high bot activity and a reputation for unhinged and radical political content, Twitter still has plenty to offer to both brands and users. Maybe, we’re on the eve of a new era for the platform, powered by real-time pop culture coverage and fan culture. Will Twitter be able to recover its former glory? Only time will tell.
FAQ
Does this prove X Premium doesn’t increase reach?
No. It shows one verified account in a small, uncontrolled sample did not out-reach two other accounts. Buffer’s 18.8-million-post study finds a large average Premium advantage, so a controlled test is needed to separate the subscription from posting habits and content.
Do link posts get penalized on X?
The evidence conflicts. Buffer found link posts from non-Premium accounts at roughly 0% engagement from March 2025, but Elon Musk said in July 2026 that X had not penalized links for over a year, and PPC Land’s review of the released code found no URL-targeting rule. Posting the substance natively and putting the link in a reply is the lower-risk approach.
Is X’s algorithm really open source?
Substantially. The repository is public under an Apache 2.0 license, but some pieces are deliberately withheld, including the Grok prompts used for content classification, and live parameter values can differ from the repository defaults.
Should brands ignore follower count?
No. Followers are a reachable audience record, but they don’t forecast how far any single post travels.

By Aaron Marco Arias